- 您現(xiàn)在的位置:買賣IC網(wǎng) > PDF目錄383838 > ST20-SWC-SUN Stratix II GX FPGA 30K FPGA-780 PDF資料下載
參數(shù)資料
| 型號: | ST20-SWC-SUN |
| 英文描述: | Stratix II GX FPGA 30K FPGA-780 |
| 中文描述: | 的ST20軟件開發(fā)和調(diào)試工具 |
| 文件頁數(shù): | 15/21頁 |
| 文件大小: | 360K |
| 代理商: | ST20-SWC-SUN |
ST20–SWC
15/21
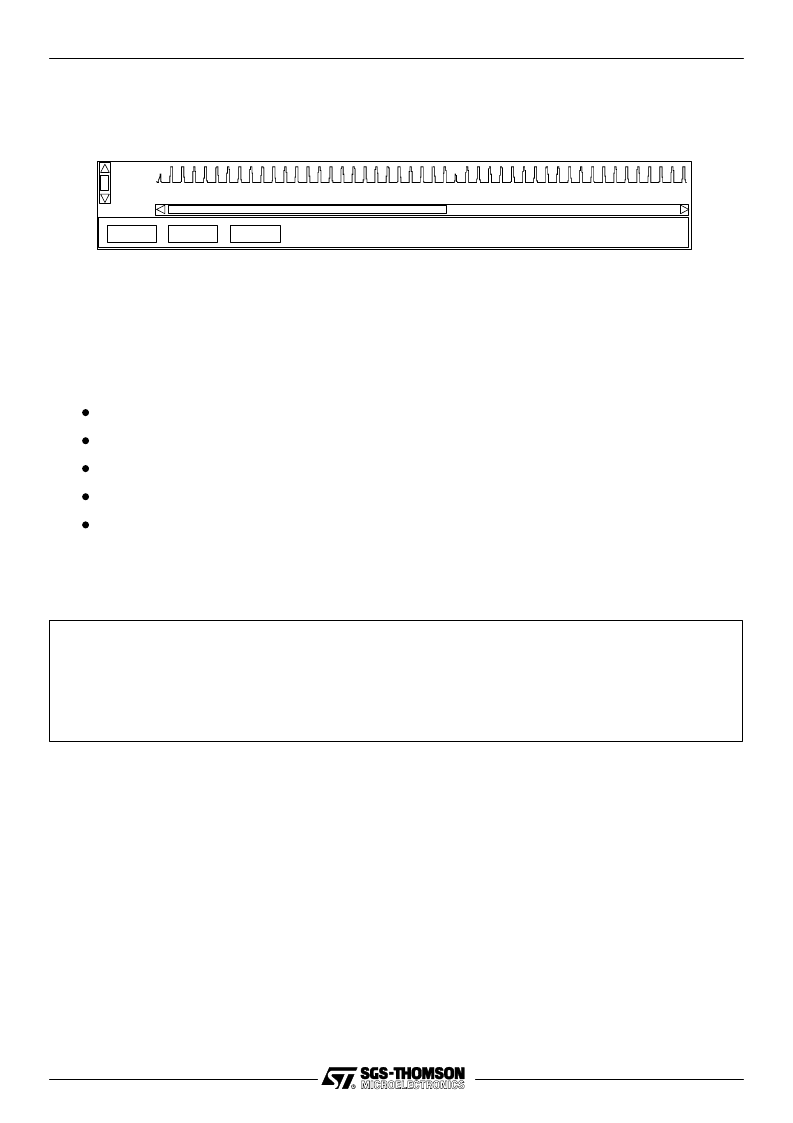
execution against time using X Window System and OSF/Motif on a Sun-4 or Microsoft Windows on
a PC.
As with the execution profiler, the user program is monitored by a profiling kernel. The kernel will slow
the program by less than 5%.
ST20
Quit
Zoom In
Zoom Out
0.000
3.840
7.680
11.520
15.360
19.200
23.040
26.880
30.720
34.560
Figure 11
Example X-Windows display from the utilization monitor
4.3
Test coverage and block profiling tool
This tool monitors test coverage and performs block profiling for an application which has been run
on target hardware.
This tool is able to:
provide an overall test coverage report;
provide per module test coverage reports;
accumulate a single report from multiple test runs;
provide a detailed basic block profiling output by creating an annotated program listing;
provide output that can be fed back into the compiler as a part of its optimization process.
The application program (compiled with the appropriate compiler option) is run and accumulates the
counts in the memory of the target processor. The tool is used to extract the results and save,
accumulate or display them. This application writes the counts into the code area, so the tool cannot
be used with code running from ROM.
Writing coverage file ”square.v” – 40% coverage
Writing coverage file ”comms.v” – 14% coverage
Writing coverage file ”app.v” – 75% coverage
Writing coverage file ”control.v” – 36% coverage
Writing coverage file ”feed.v” – 33% coverage
Writing coverage file ”sum.v” – 40% coverage
Total coverage for bootable 39% over 1 run
Figure 12
Example test coverage summary report
The following is an example of the contents of a coverage file:
|/*
| * facs.c
| *
| * generate factorials
| *
| */
|
|#include <stdio.h>
|#include <stdlib.h>
|#include <process.h>
|#include <channel.h>
|#include <misc.h>
|#include ”comms.h”
|
|#define TRUE 1
|#define FALSE 0
|
|
相關(guān)PDF資料 |
PDF描述 |
|---|---|
| ST203C10CFJ0 | Stratix II GX FPGA 130K FPGA-1508 |
| ST203C12CFJ0 | Stratix II GX FPGA 130K FPGA-1508 |
| ST203S10PFJ0 | Stratix II GX FPGA 130K FPGA-40 |
| ST203S12PFJ0 | Stratix II GX FPGA 90K FPGA-35 |
| ST2044 | Stratix II FPGA 130K FBGA-1020 |
相關(guān)代理商/技術(shù)參數(shù) |
參數(shù)描述 |
|---|---|
| ST20TOOLSET | 制造商:未知廠家 制造商全稱:未知廠家 功能描述:ST20 software development and debugging tools |
| ST20-TOOLSET/PC | 制造商:STMicroelectronics 功能描述:ST20 DEVELOPMENT TOOLS - Bulk |
| ST20TP1X40S | 制造商:未知廠家 制造商全稱:未知廠家 功能描述:Interface IC |
| ST20TP2X40S | 制造商:未知廠家 制造商全稱:未知廠家 功能描述:Communications Interface |
| ST20TP2X50S | 制造商:未知廠家 制造商全稱:未知廠家 功能描述:Communications Interface |
發(fā)布緊急采購,3分鐘左右您將得到回復(fù)。