- 您現(xiàn)在的位置:買賣IC網(wǎng) > PDF目錄376245 > OP484 (Analog Devices, Inc.) Precision Rail-to-Rail Input & Output Operational Amplifiers(精密滿幅度輸入輸出運放) PDF資料下載
參數(shù)資料
| 型號: | OP484 |
| 廠商: | Analog Devices, Inc. |
| 英文描述: | Precision Rail-to-Rail Input & Output Operational Amplifiers(精密滿幅度輸入輸出運放) |
| 中文描述: | 精密軌到軌輸入 |
| 文件頁數(shù): | 12/20頁 |
| 文件大小: | 370K |
| 代理商: | OP484 |

REV. 0
–12–
OP184/OP284/OP484
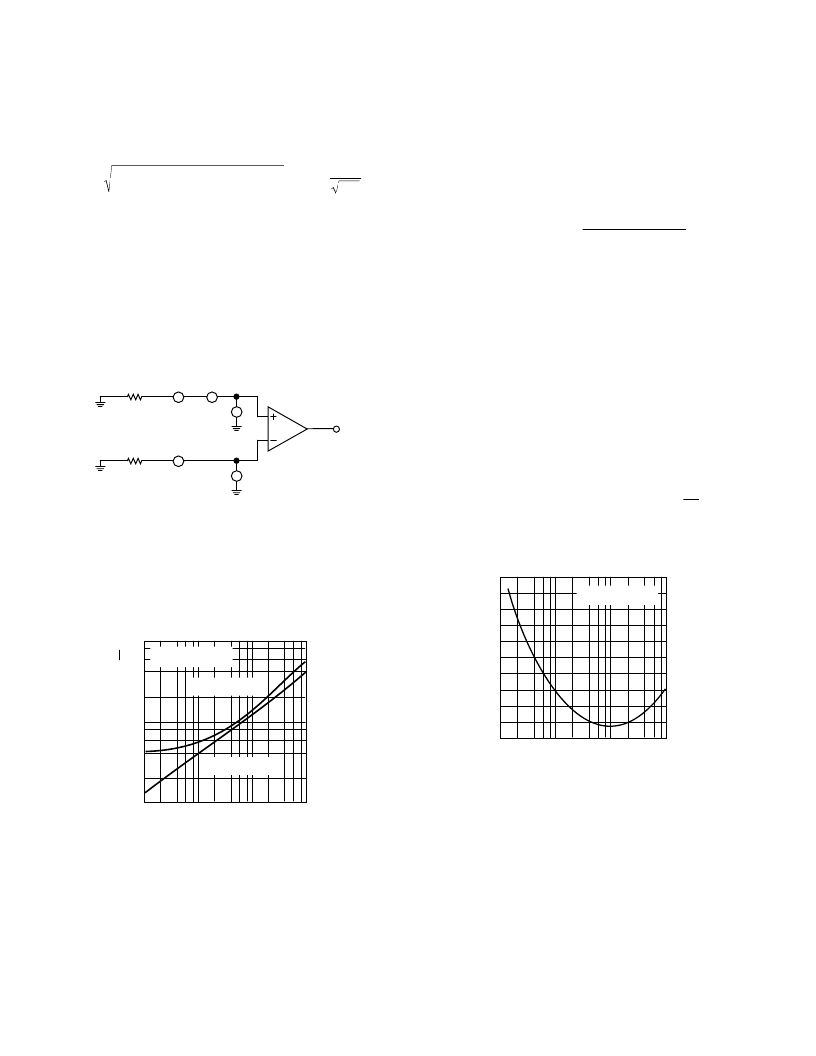
Referring to the op amp noise model circuit configuration illus-
trated in Figure 45, the expression for an amplifier’s total
equivalent input noise voltage for a source resistance level R
S
is
given by:
[
e
nT
=
2
e
nR
(
)
2
+
i
nOA
×
R
(
)
2
]
+
e
nOA
(
)
2
,
units inV
Hz
where R
S
= 2R = Effective, or equivalent, circuit source
resistance,
(
e
nOA
)
2
= Op amp equivalent input noise voltage spectral
power (1 Hz BW),
(
i
nOA
)
2
= Op amp equivalent input noise current spectral
power (1 Hz BW),
(
e
nR
)
2
= Source resistance thermal noise voltage power =
(4kT R),
k
= Boltzmann’s constant = 1.38
×
10
–23
J/K , and
T
= Ambient temperature of the circuit, in K elvin, =
273.15 + T
A
(
°
C)
i
NOA
e
NR
e
NOA
R
"NOISELESS"
i
NOA
e
NR
R
"NOISELESS"
IDEAL
NOISELESS
OP AMP
R
S
= 2R
Figure 45. Op Amp Noise Circuit Model Used to
Determine Total Circuit Equivalent Input Noise Voltage
and Noise Figure
As a design aid, Figure 46 illustrates the total equivalent input
noise of the OP284 and the total thermal noise of a resistor for
comparison. Note that for source resistance less than 1 k
, the
equivalent input noise voltage of the OP284 is dominant.
TOTAL SOURCE RESISTANCE, R
S
–
100
100
E
√
H
1k
10k
100k
10
1
OP284 TOTAL
EQUIVALENT NOISE
RESISTOR THERMAL
NOISE ONLY
FREQUENCY = 1kHz
T
A
= +25
°
C
Figure 46. OP284 Total Noise vs. Source Resistance
Since circuit SNR is the critical parameter in the final analysis,
many times the noise behavior of a circuit is expressed in terms
of its noise figure, NF. Noise figure is defined to be the ratio of
a circuit’s output signal-to-noise to its input signal-to-noise. An
expression for a circuit’s NF in dB and in terms of the opera-
tional amplifier's voltage and current noise parameters defined
previously is given by:
NF
(
dB
)
=
10 log 1
+
e
nOA
(
)
2
+
i
nOA
R
S
(
e
nRS
(
)
2
)
2
where
NF
(
dB
) = Noise figure of the circuit, expressed in dB,
R
S
= Effective, or equivalent, source resistance presented
to amplifier,
(
e
nOA
)
2
= OP284 noise voltage spectral power (1 Hz BW),
(
i
nOA
)
2
= OP284 noise current spectral power (1 Hz BW),
(
e
nRS
)
2
= Source resistance thermal noise voltage power
= (4kT R
S
),
Circuit noise figure is straightforward to calculate because the
signal level in the application is not required to determine it.
However, many designers using NF calculations as the basis for
achieving optimum SNR believe that low noise figure is equal to
low total noise. In fact, the opposite is true, as illustrated in
Figure 47. Here, the noise figure of the OP284 is expressed as a
function of the source resistance level. Note that the lowest
noise figure for the OP284 occurs at a source resistance level of
10 k
. However, Figure 46 shows that this source resistance
level and the OP284 generate approximately 14 nV/
√
Hz
of total
equivalent circuit noise. Signal levels in the application would
invariably be increased to maximize circuit SNR—not an option
in low voltage, single supply applications.
TOTAL SOURCE RESISTANCE, R
S
–
6
100
N
1k
10k
100k
4
2
0
9
10
8
7
5
3
1
FREQUENCY = 1kHz
T
A
= +25
°
C
Figure 47. OP284 Noise Figure vs. Source Resistance
In single supply applications, it is, therefore, recommended for
optimum circuit SNR to choose an operational amplifier with
the lowest equivalent input noise voltage and to choose source
resistance levels consistent in maintaining low total circuit noise.
相關(guān)PDF資料 |
PDF描述 |
|---|---|
| OP490FY | Low Voltage Micropower Quad Operational Amplifier |
| OP490AY | Low Voltage Micropower Quad Operational Amplifier |
| OP490EY | Low Voltage Micropower Quad Operational Amplifier |
| OP490GP | Low Voltage Micropower Quad Operational Amplifier |
| OP490GS | Low Voltage Micropower Quad Operational Amplifier |
相關(guān)代理商/技術(shù)參數(shù) |
參數(shù)描述 |
|---|---|
| OP4840002C | 制造商:Analog Devices 功能描述: |
| OP4840016SZR7 | 制造商:Analog Devices 功能描述: |
| OP484AM-EMX | 制造商:Analog Devices 功能描述:OP484AM-EMX - Bulk |
| OP484AY/QMLR | 制造商:Analog Devices 功能描述: |
發(fā)布緊急采購,3分鐘左右您將得到回復(fù)。