- 您現(xiàn)在的位置:買賣IC網(wǎng) > PDF目錄368053 > PLX9656 I/O Accelerator|PCI9656 Data Book Corrections PDF資料下載
參數(shù)資料
| 型號: | PLX9656 |
| 英文描述: | I/O Accelerator|PCI9656 Data Book Corrections |
| 中文描述: | I / O加速器| PCI9656數(shù)據(jù)手冊更正 |
| 文件頁數(shù): | 17/28頁 |
| 文件大小: | 162K |
| 代理商: | PLX9656 |
第1頁第2頁第3頁第4頁第5頁第6頁第7頁第8頁第9頁第10頁第11頁第12頁第13頁第14頁第15頁第16頁當(dāng)前第17頁第18頁第19頁第20頁第21頁第22頁第23頁第24頁第25頁第26頁第27頁第28頁
12/19/2002
- 17 -
9656-SIL-DC1-P0-.96
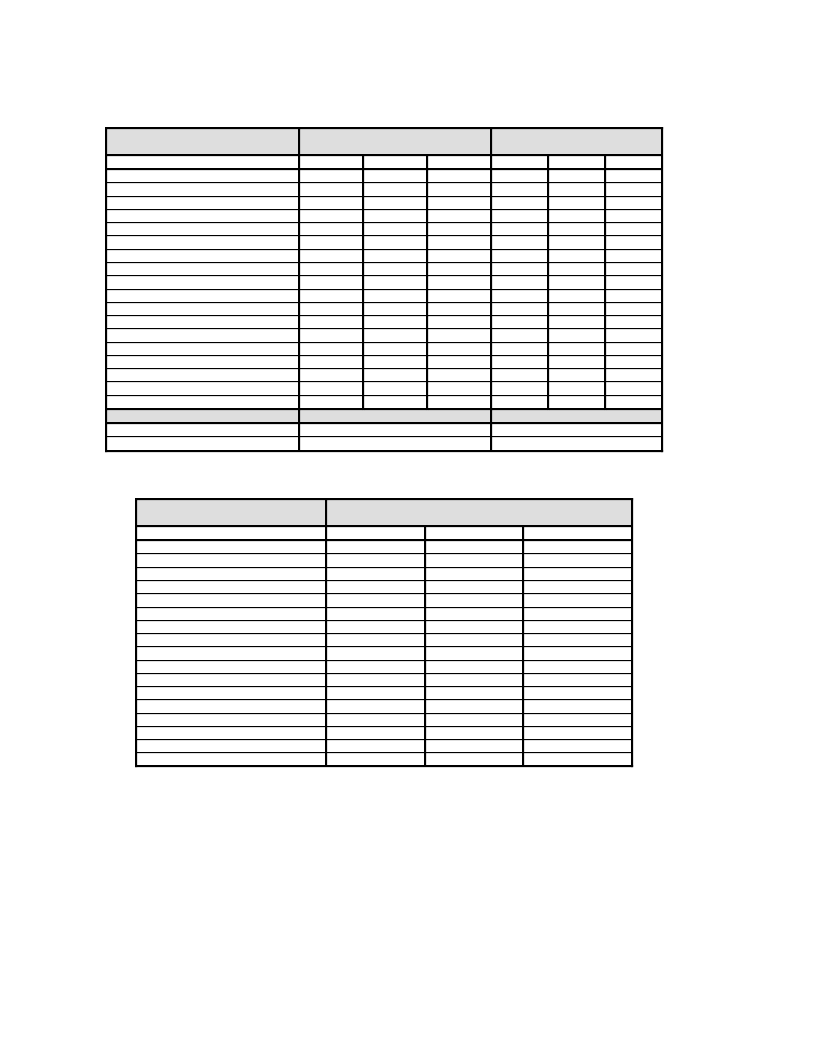
Table 15. M Mode Local Bus Input AC Timing Specifications
Signals
(Synchronous Inputs)
(V
CC
= 3.0V, T
a
= 85°C)
Blue Book
4.5 ns
4.5 ns
4.5 ns
4.5 ns
BIGEND#/WAIT#
4.5 ns
BURST#
4.5 ns
CCS#
4.5 ns
DP[0:3]
4.5 ns
DREQ[1:0]#
4.5 ns
LA[0:31]
4.5 ns
LD[0:31]
4.5 ns
MDREQ#/DMPAF/
EOT#
4.5 ns
RD/WR#
4.5 ns
TA#
4.5 ns
TEA#
4.5 ns
TS#
4.5 ns
TSIZ[0:1]#
4.5 ns
USERi/LLOCK#
4.5 ns
Input Clocks
Local Clock Input Frequency
PCI Clock Input Frequency
T
SETUP
T
HOLD
BB#
BDIP#
BG#
BI#
AD STA
4.9 ns
4.5 ns
4.4 ns
5.3 ns
4.8 ns
4.8 ns
1.7 ns
2.0 ns
4.4 ns
5.2 ns
4.9 ns
4.7 ns
5.3 ns
5.3 ns
5.2 ns
4.8 ns
5.0 ns
1.9 ns
Min
0 MHz
0 MHz
BA STA
2.7 ns
3.8 ns
2.9 ns
4.0 ns
3.8 ns
4.1 ns
2.9 ns
2.9 ns
3.3 ns
3.6 ns
3.1 ns
4.2 ns
3.5 ns
4.1 ns
4.4 ns
2.1 ns
3.6 ns
3.2 ns
Blue Book
1 ns
1 ns
1 ns
1 ns
1 ns
1 ns
1 ns
1 ns
1 ns
1 ns
1 ns
1 ns
1 ns
1 ns
1 ns
1 ns
1 ns
1 ns
AD STA
1 ns
1 ns
1 ns
1 ns
1 ns
1 ns
1 ns
1 ns
1 ns
1 ns
1 ns
1 ns
1 ns
1 ns
1 ns
1 ns
1 ns
1 ns
Max
66 MHz
66 MHz
BA STA
1 ns
1 ns
1 ns
1 ns
1 ns
1 ns
1 ns
1 ns
1 ns
1 ns
1 ns
1 ns
1 ns
1 ns
1 ns
1 ns
1 ns
1 ns
Table 16. M Mode Local Bus Output AC Timing Specifications
Signals
(Synchronous Outputs)
Blue Book
9 ns
BDIP#
BIGEND#/
WAIT#
BR#
BURST#
DACK[1:0]#
DP[0:3]
LA[0:31]
LD[0:31]
MDREQ#/DMPAF/
EOT#
RD/WR#
RETRY#
TA#
TEA#
TS#
TSIZ[0:1]#
USERo/LLOCKo#
Output T
VALID
(C
L
= 50pF, V
CC
= 3.0V, T
a
= 85°C)
AD
1
STA
9.4 ns
7.7 ns
7.6 ns
7.5 ns
7.6 ns
7.6 ns
7.9 ns
8.0 ns
7.8 ns
8.5 ns
7.6 ns
9.5 ns
9.0 ns
9.6 ns
7.6 ns
7.6 ns
7.6 ns
BB#
BA
2
STA
6.8 ns
6.4 ns
6.3 ns
6.8 ns
6.3 ns
6.3 ns
6.8 ns
6.8 ns
6.3 ns
6.6 ns
6.3 ns
6.8 ns
7.2 ns
7.5 ns
6.3 ns
6.3 ns
6.3 ns
9 ns
9 ns
9 ns
9 ns
9 ns
9 ns
9 ns
9 ns
9 ns
9 ns
9 ns
9 ns
9 ns
9 ns
9 ns
9 ns
1
On high-to-low transitions, output T
VALID
values increase/decrease by 23 ps for each increase/decrease of 1pF.
On low-to-high transitions, output T
VALID
values increase/decrease by 20 ps for each increase/decrease of 1pF.
2
On high-to-low transitions, output T
VALID
values increase/decrease by 16 ps for each increase/decrease of 1pF.
On low-to-high transitions, output T
VALID
values increase/decrease by 20 ps for each increase/decrease of 1pF.
On high-to-low transitions, the slew rate at 50 pF loading is 1.93 V/ns typical; .94 V/ns worst case.
On low-to-high transitions, the slew rate at 50 pF loading is 1.15 V/ns typical; .70 V/ns worst case.
相關(guān)PDF資料 |
PDF描述 |
|---|---|
| PM-010 | PCMCIA RS232 2 PORT |
| PM-020 | PCMCIA RS232 1 PORT |
| PM-121 | PCMCIA RS422/485 2PORT |
| PM-120 | PCMCIA RS422/485 1 PORT |
| PM-H722HC | 0-5Vdc Current transducer |
相關(guān)代理商/技術(shù)參數(shù) |
參數(shù)描述 |
|---|---|
| PL-XLD-00-SH0-C5 | 制造商:JDSU 制造商全稱:JDS Uniphase Corporation 功能描述:850 nm 8.5 G TOSA |
| PLXPCI6140 | 制造商:PERICOM 制造商全稱:Pericom Semiconductor Corporation 功能描述:2 PORT PCI TO PCI BRIDGE PLX PCI 6140 COMPARISON |
| PL-XPL-00-S23-28 | 制造商:PICO_ELEC 功能描述: |
| PLXWV | 制造商:Thomas & Betts 功能描述:Metallic Steel Wall Mount Steel City Metallic Box |
| PL-XXD-00-S40-CX | 制造商:JDSU 制造商全稱:JDS Uniphase Corporation 功能描述:850 nm 10 G TOSA |
發(fā)布緊急采購,3分鐘左右您將得到回復(fù)。